About me

我的照片
目前就职于杭州某电子商务公司,工作兴趣包括高并发分布式架构,JVM性能优化等方面。

2012年1月29日星期日

JAVA程序的性能瓶颈

常见的性能瓶颈
  • CPU
  • 内存:频繁的ygc和fgc
  • 异常程序不断处理异常信息
  • 同步:程序等待共享资源被释放
  • 本地IO和网络IO:等待数据读写到磁盘或网络,或者数据库操作


系统性能与调优的关系

Ø调优的作用:在当前的系统基础上,找出性能(内存)瓶颈点,寻找解决方案(二八规则:百分二十以下的代码消耗了80%的系统性能)
Ø系统性能:一个高性能的应用不是靠后期调优调出来的。以下要素必不可少:
l一个正确的总体设计策略;
lJava编码技巧,遵循java编码规范;
l编码完成后对应用关键点的调优;


问题在哪里

l性能:哪些方法被调用消耗Cpu时间最多;因素有两个
n单次运行耗时
n方法在应用服务时的运行次数
l内存:内存中的对象主要是哪些,数量有多少;
n内存常驻对象;
n方法体中生成的运行期对象;


找到原因

Ø找出系统数据(内存消耗分布、代码Cpu耗时比例)后进行针对的代码分析,看是否是正常的消耗。
Ø工具能够引导你把注意力集中到关键点上,但系统调优是否有效还在于你在分析对应点的代码后,是否能够找到更好的解决方案。
Ø性能跟踪工具仅仅是一个度量工具,最宝贵的还是你的头脑,技术上的思路&对业务的熟悉度。
Ø仔细读代码,代码是否有问题!有没有不必要的开销
Ø认真分析业务,看有没有其他的实现方式


制定对策

Ø集中力量优化占用80%性能、内存的代码段
Ø优化后,系统性能瓶颈会发生转变(性能开销比例发生变化),需要重新采集数据


案例
ØList页面的调优,页面展示会是一个大问题,Url的渲染!
l大量链接的渲染,通过建立一个链接渲染工具来实现(建立参数基准),生成时从内部缓存快速拼接生成;
Ø大量内存中的缓存对象: 性能与内存占用的权衡
lObject – 成员变量的类型 尽量使用简单类型
l不要建立空的容器对象 list<***> 

2012年1月20日星期五

Linux性能监控命令

CPU监控
  1. vmstat
  2. mpstat:可以看到每个核的利用率,中断次数
  3. top:从进程角度查看
  4. sar:看历史. sar -f /var/log/sa/sa07
TOP的交互命令中,f表示选择输出字段。F表示选择排序使用的字段。

内存监控
  1. free -m
  2. vmstat
  3. top
  4. pmap:查看进程所有的VMA(vm_area_struct)列表
这里解释一下free -m的输出内容。
-bash-3.2$ free -m
             total       used       free     shared    buffers     cached
Mem:         24098      23135        963          0        556      18022
-/+ buffers/cache:       4556      19542
Swap:         2047          0       2047


total = used + free
used  = AppUsed + buffers + cachedbuffers 表示块设备读写缓冲区大小。
cached  表示文件系统缓存大小。

第三行第一个字段,表示 used-buffer-cache,也就是被应用使用掉的物理内存大小。第二个字段,表示free+cache+buffer,也就是还可以被应用程序挪用的物理内存大小。

IO监控
  1. iostat -x 1:分辨顺序IO还是随机IO
  2. sar -B 1
  3. top

这里再说明一下iostat的输出。svctm是service time的缩写,表示块设备处理请求耗时。await字段是请求被处理前的等待时间。

avg-cpu:  %user   %nice %system %iowait  %steal   %idle
           9.43    0.00    0.56    0.00    0.00   90.01

Device:         rrqm/s   wrqm/s   r/s   w/s   rsec/s   wsec/s avgrq-sz avgqu-sz   await  svctm  %util
sda               0.00     0.00  0.00  0.00     0.00     0.00     0.00     0.00    0.00   0.00   0.00
sda1              0.00     0.00  0.00  0.00     0.00     0.00     0.00     0.00    0.00   0.00   0.00
sda2              0.00     0.00  0.00  0.00     0.00     0.00     0.00     0.00    0.00   0.00   0.00
sda3              0.00     0.00  0.00  0.00     0.00     0.00     0.00     0.00    0.00   0.00   0.00
sda4              0.00     0.00  0.00  0.00     0.00     0.00     0.00     0.00    0.00   0.00   0.00
sda5              0.00     0.00  0.00  0.00     0.00     0.00     0.00     0.00    0.00   0.00   0.00
sda6              0.00     0.00  0.00  0.00     0.00     0.00     0.00     0.00    0.00   0.00   0.00
sda7              0.00     0.00  0.00  0.00     0.00     0.00     0.00     0.00    0.00   0.00   0.00
sda8              0.00     0.00  0.00  0.00     0.00     0.00     0.00     0.00    0.00   0.00   0.00
sda9              0.00     0.00  0.00  0.00     0.00     0.00     0.00     0.00    0.00   0.00   0.00

使用strace监控java进程


监控java这样一般启动多线程的进程,简单的strace -p pid什么也看不到。需要增加 -f 这个参数,man上说这个参数的意思是监控该进程及其子进程。
strace -f -p pid

统计syscall的调用次数和耗时
strace -f -p 27847 -c


% time     seconds  usecs/call     calls    errors syscall
------ ----------- ----------- --------- --------- ----------------
 66.10    6.520408        2443      2669       547 futex
 33.35    3.289478         534      6162           epoll_wait
  0.46    0.044990        1730        26           poll
  0.03    0.002859           0      8526           write
  0.03    0.002723           0     35537           clock_gettime
  0.03    0.002645           0      9916      3306 read
  0.01    0.001059           0      3379         9 epoll_ctl
  0.01    0.000501           0      3327           getsockopt
  0.00    0.000033           2        18           sendto
  0.00    0.000000           0         9           close
  0.00    0.000000           0         2           stat
  0.00    0.000000           0        20           mprotect
  0.00    0.000000           0         2           rt_sigreturn
  0.00    0.000000           0         3           sched_yield
  0.00    0.000000           0         9           dup2
  0.00    0.000000           0        10           accept
  0.00    0.000000           0        26           recvfrom
  0.00    0.000000           0        10           getsockname
  0.00    0.000000           0        45           setsockopt
  0.00    0.000000           0        30           fcntl
------ ----------- ----------- --------- --------- ----------------
100.00    9.864696                 69726      3862 total


Linux内存页分类

Linux的逻辑页分为三种:

第一种,代码页,只读。由磁盘支持,保存程序的二进制代码。

第二种,内存映射页,映射到磁盘上的文件,有只读的,也有可读可写的。只读的文件页可以映射到动态库。可读写的页在写后变脏,由pdflush进程

第三种,数据页,也叫匿名页。没有磁盘提供支持,在进程启动后动态创建的数据。只有该类型的页才会被换出到swap。

JAVA进程内存泄漏分析思路


  1. 有无使用Native内存。通常需要通过对比进程的VSZ大小和java堆大小来发现。java里面的DirectByteBuffer是一种冰山对象,它在java heap中很小,但却引用了一块在native内存中的区域,所以你通过heap dump有可能根本看不出问题。java在创建DirectByteBuffer时,如果native内存不足,java会显式调用System.gc()来执行Full gc,这包括回收native内存。如果应用很不幸地增加了启动参数 -XX:+DisableExplicitGC,JVM就会抛出OOM异常。
  2. java堆有无泄漏。分析Dump。
需要用到的命令:top,pmap,jstat,jmap

JVM参数

-XX:-DontCompileHugeMethods
true表示如果方法的字节码大于8000 bytes,即使调用次数超过1w次,JIT也不会把该方法编译为本地代码。但设置为false也有风险,一旦code cache满,JIT就会停止后续所有编译任务。

JConsole上可以看到code cache(non-heap)的大小,VisualVM好像还看不到。

-XX:+PrintCompilation
true表示输出JIT编译信息。

-X:CompilationThreshold
方法被编译为本地代码前需要被调用的次数,server模式下默认为10000次。
一个小时有3600秒,即使每秒只有3个请求,那么一个小时也足够热点方法被编译为本地代码了。

-XX:MaxInlineSize
被内联方法的最大大小。


转译 Atonamy of a Program in Memory

这篇仍然选自Gustavo的最佳系列文章,英文名称是Atonamy of a Program in Memory,
不过我发现网上已经有很棒的译文了,这里就转贴一下。

Memory management is the heart of operating systems; it is crucial for both programming and system administration. In the next few posts I’ll cover memory with an eye towards practical aspects, but without shying away from internals. While the concepts are generic, examples are mostly from Linux and Windows on 32-bit x86. This first post describes how programs are laid out in memory.
内存管理模块是操作系统的心脏;它对应用程序和系统管理非常重要。今后的几篇文章中,我将着眼于实际的内存问题,但也不避讳其中的技术内幕。由于不少概念是通用的,所以文中大部分例子取自32位x86平台的Linux和Windows系统。本系列第一篇文章讲述应用程序的内存布局。


Each process in a multi-tasking OS runs in its own memory sandbox. This sandbox is the virtual address space, which in 32-bit mode is always a 4GB block of memory addresses. These virtual addresses are mapped to physical memory by page tables, which are maintained by the operating system kernel and consulted by the processor. Each process has its own set of page tables, but there is a catch. Once virtual addresses are enabled, they apply to all software running in the machine, including the kernel itself. Thus a portion of the virtual address space must be reserved to the kernel:
在多任务操作系统中的每一个进程都运行在一个属于它自己的内存沙盘中。这个沙盘就是虚拟地址空间(virtual address space),在32位模式下它总是一个4GB的内存地址块。这些虚拟地址通过页表(page table)映射到物理内存,页表由操作系统维护并被处理器引用。每一个进程拥有一套属于它自己的页表,但是还有一个隐情。只要虚拟地址被使能,那么它就会作用于这台机器上运行的所有软件,包括内核本身。因此一部分虚拟地址必须保留给内核使用:


This does not mean the kernel uses that much physical memory, only that it has that portion of address space available to map whatever physical memory it wishes. Kernel space is flagged in the page tables as exclusive to privileged code (ring 2 or lower), hence a page fault is triggered if user-mode programs try to touch it. In Linux, kernel space is constantly present and maps the same physical memory in all processes. Kernel code and data are always addressable, ready to handle interrupts or system calls at any time. By contrast, the mapping for the user-mode portion of the address space changes whenever a process switch happens:
这并不意味着内核使用了那么多的物理内存,仅表示它可支配这么大的地址空间,可根据内核需要,将其映射到物理内存。内核空间在页表中拥有较高的特权级(ring 2或以下),因此只要用户态的程序试图访问这些页,就会导致一个页错误(page fault)。在Linux中,内核空间是持续存在的,并且在所有进程中都映射到同样的物理内存。内核代码和数据总是可寻址的,随时准备处理中断和系统调用。与此相反,用户模式地址空间的映射随进程切换的发生而不断变化:


Blue regions represent virtual addresses that are mapped to physical memory, whereas white regions are unmapped. In the example above, Firefox has used far more of its virtual address space due to its legendary memory hunger. The distinct bands in the address space correspond to memory segments like the heap, stack, and so on. Keep in mind these segments are simply a range of memory addresses and have nothing to do with Intel-style segments. Anyway, here is the standard segment layout in a Linux process:
蓝色区域表示映射到物理内存的虚拟地址,而白色区域表示未映射的部分。在上面的例子中,Firefox使用了相当多的虚拟地址空间,因为它是传说中的吃内存大户。地址空间中的各个条带对应于不同的内存段(memory segment),如:堆、栈之类的。记住,这些段只是简单的内存地址范围,与Intel处理器的段没有关系。不管怎样,下面是一个Linux进程的标准的内存段布局:


When computing was happy and safe and cuddly, the starting virtual addresses for the segments shown above were exactly the same for nearly every process in a machine. This made it easy to exploit security vulnerabilities remotely. An exploit often needs to reference absolute memory locations: an address on the stack, the address for a library function, etc. Remote attackers must choose this location blindly, counting on the fact that address spaces are all the same. When they are, people get pwned. Thus address space randomization has become popular. Linux randomizes thestackmemory mapping segment, and heap by adding offsets to their starting addresses. Unfortunately the 32-bit address space is pretty tight, leaving little room for randomization andhampering its effectiveness.
当计算机开心、安全、可爱、正常的运转时,几乎每一个进程的各个段的起始虚拟地址都与上图完全一致,这也给远程发掘程序安全漏洞打开了方便之门。一个发掘过程往往需要引用绝对内存地址:栈地址,库函数地址等。远程攻击者必须依赖地址空间布局的一致性,摸索着选择这些地址。如果让他们猜个正着,有人就会被整了。因此,地址空间的随机排布方式逐渐流行起来。Linux 通过对内存映射段的起始地址加上随机的偏移量来打乱布局。不幸的是,32 位地址空间相当紧凑,给随机化所留下的空当不大,削弱了这种技巧的效果


The topmost segment in the process address space is the stack, which stores local variables and function parameters in most programming languages. Calling a method or function pushes a newstack frame onto the stack. The stack frame is destroyed when the function returns. This simple design, possible because the data obeys strict LIFO order, means that no complex data structure is needed to track stack contents – a simple pointer to the top of the stack will do. Pushing and popping are thus very fast and deterministic. Also, the constant reuse of stack regions tends to keep active stack memory in the cpu caches, speeding up access. Each thread in a process gets its own stack.
进程地址空间中最顶部的段是栈,大多数编程语言将之用于存储局部变量和函数参数。调用一个方法或函数会将一个新的栈桢(stack frame)压入栈中。栈桢在函数返回时被清理。也许是因为数据严格的遵从LIFO的顺序,这个简单的设计意味着不必使用复杂的数据结构来追踪栈的内容,只需要一个简单的指针指向栈的顶端即可。因此压栈(pushing)和退栈(popping)过程非常迅速、准确。另外,持续的重用栈空间有助于使活跃的栈内存保持在CPU缓存中,从而加速访问。进程中的每一个线程都有属于自己的栈。


It is possible to exhaust the area mapping the stack by pushing more data than it can fit. This triggers a page fault that is handled in Linux by expand_stack(), which in turn callsacct_stack_growth() to check whether it’s appropriate to grow the stack. If the stack size is belowRLIMIT_STACK (usually 8MB), then normally the stack grows and the program continues merrily, unaware of what just happened. This is the normal mechanism whereby stack size adjusts to demand. However, if the maximum stack size has been reached, we have a stack overflow and the program receives a Segmentation Fault. While the mapped stack area expands to meet demand, it does not shrink back when the stack gets smaller. Like the federal budget, it only expands.
通过不断向栈中压入的数据,超出其容量就有会耗尽栈所对应的内存区域。这将触发一个页故障(page fault),并被 Linux 的expand_stack()处理,它会调用acct_stack_growth()来检查是否还有合适的地方用于栈的增长。如果栈的大小低于RLIMIT_STACK(通常是8MB),那么一般情况下栈会被加长,程序继续愉快的运行,感觉不到发生了什么事情。这是一种将栈扩展至所需大小的常规机制。然而,如果达到了最大的栈空间大小,就会栈溢出(stack overflow),程序收到一个段错误(Segmentation Fault)。当映射了的栈区域扩展到所需的大小后,它就不会再收缩回去,即使栈不那么满了。这就好比联邦预算,它总是在增长的。


Dynamic stack growth is the only situation in which access to an unmapped memory region, shown in white above, might be valid. Any other access to unmapped memory triggers a page fault that results in a Segmentation Fault. Some mapped areas are read-only, hence write attempts to these areas also lead to segfaults.
动态栈增长是唯一一种访问未映射内存区域(图中白色区域)而被允许的情形。其它任何对未映射内存区域的访问都会触发页故障,从而导致段错误。一些被映射的区域是只读的,因此企图写这些区域也会导致段错误。


Below the stack, we have the memory mapping segment. Here the kernel maps contents of files directly to memory. Any application can ask for such a mapping via the Linux mmap() system call (implementation) or CreateFileMapping() / MapViewOfFile() in Windows. Memory mapping is a convenient and high-performance way to do file I/O, so it is used for loading dynamic libraries. It is also possible to create an anonymous memory mapping that does not correspond to any files, being used instead for program data. In Linux, if you request a large block of memory via malloc(), the C library will create such an anonymous mapping instead of using heap memory. ‘Large’ means larger than MMAP_THRESHOLD bytes, 128 kB by default and adjustable via mallopt().
在栈的下方,是我们的内存映射段。此处,内核将文件的内容直接映射到内存。任何应用程序都可以通过 Linux 的 mmap() 系统调用(实现)或 Windows 的 CreateFileMapping()/MapViewOfFile()请求这种映射。内存映射是一种方便高效的文件 I/O 方式,所以它被用于加载动态库。创建一个不对应于任何文件的匿名内存映射也是可能的,此方法用于存放程序的数据。在 Linux 中,如果你通过 malloc()请求一大块内存,C 运行库将会创建这样一个匿名映射而不是使用堆内存。‘大块’意味着比MMAP_THRESHOLD 还大,缺省是 128KB ,可以通过mallopt()调整。


Speaking of the heap, it comes next in our plunge into address space. The heap provides runtime memory allocation, like the stack, meant for data that must outlive the function doing the allocation, unlike the stack. Most languages provide heap management to programs. Satisfying memory requests is thus a joint affair between the language runtime and the kernel. In C, the interface to heap allocation is malloc() and friends, whereas in a garbage-collected language like C# the interface is thenew keyword.
说到堆,它是接下来的一块地址空间。与栈一样,堆用于运行时内存分配;但不同点是,堆用于存储那些生存期与函数调用无关的数据。大部分语言都提供了堆管理功能。因此,满足内存请求就成了语言运行时库及内核共同的任务。在 C 语言中,堆分配的接口是malloc()系列函数,而在具有垃圾收集功能的语言(如 C# )中,此接口是 new 关键字。


If there is enough space in the heap to satisfy a memory request, it can be handled by the language runtime without kernel involvement. Otherwise the heap is enlarged via the brk() system call (implementation) to make room for the requested block. Heap management is complex, requiring sophisticated algorithms that strive for speed and efficient memory usage in the face of our programs’ chaotic allocation patterns. The time needed to service a heap request can vary substantially. Real-time systems have special-purpose allocators to deal with this problem. Heaps also becomefragmented, shown below:
如果堆中有足够的空间来满足内存请求,它就可以被语言运行时库处理而不需要内核参与。否则,堆会被扩大,通过brk()系统调用(实现)来分配请求所需的内存块。堆管理是很复杂的,需要精细的算法,应付我们程序中杂乱的分配模式,优化速度和内存使用效率。处理一个堆请求所需的时间会大幅度的变动。实时系统通过特殊目的分配器来解决这个问题。堆也可能会变得零零碎碎,如下图所示:


Finally, we get to the lowest segments of memory: BSS, data, and program text. Both BSS and data store contents for static (global) variables in C. The difference is that BSS stores the contents ofuninitialized static variables, whose values are not set by the programmer in source code. The BSS memory area is anonymous: it does not map any file. If you say static int cntActiveUsers, the contents of cntActiveUsers live in the BSS.
最后,我们来看看最底部的内存段:BSS,数据段,代码段。在C语言中,BSS和数据段保存的都是静态(全局)变量的内容。区别在于BSS保存的是未被初始化的静态变量内容,它们的值不是直接在程序的源代码中设定的。BSS内存区域是匿名的:它不映射到任何文件。如果你写static int cntActiveUsers,则cntActiveUsers的内容就会保存在BSS中。


The data segment, on the other hand, holds the contents for static variables initialized in source code. This memory area is not anonymous. It maps the part of the program’s binary image that contains the initial static values given in source code. So if you say static int cntWorkerBees = 10, the contents of cntWorkerBees live in the data segment and start out as 10. Even though the data segment maps a file, it is a private memory mapping, which means that updates to memory are not reflected in the underlying file. This must be the case, otherwise assignments to global variables would change your on-disk binary image. Inconceivable!
另一方面,数据段保存在源代码中已经初始化了的静态变量内容。这个内存区域不是匿名的。它映射了一部分的程序二进制镜像,也就是源代码中指定了初始值的静态变量。所以,如果你写static int cntWorkerBees = 10,则cntWorkerBees的内容就保存在数据段中了,而且初始值为10。尽管数据段映射了一个文件,但它是一个私有内存映射,这意味着更改此处的内存不会影响到被映射的文件。也必须如此,否则给全局变量赋值将会改动你硬盘上的二进制镜像,这是不可想象的。


The data example in the diagram is trickier because it uses a pointer. In that case, the contents of pointer gonzo – a 4-byte memory address – live in the data segment. The actual string it points to does not, however. The string lives in the text segment, which is read-only and stores all of your code in addition to tidbits like string literals. The text segment also maps your binary file in memory, but writes to this area earn your program a Segmentation Fault. This helps prevent pointer bugs, though not as effectively as avoiding C in the first place. Here’s a diagram showing these segments and our example variables:
下图中数据段的例子更加复杂,因为它用了一个指针。在此情况下,指针gonzo(4字节内存地址)本身的值保存在数据段中。而它所指向的实际字符串则不在这里。这个字符串保存在代码段中,代码段是只读的,保存了你全部的代码外加零零碎碎的东西,比如字符串字面值。代码段将你的二进制文件也映射到了内存中,但对此区域的写操作都会使你的程序收到段错误。这有助于防范指针错误,虽然不像在C语言编程时就注意防范来得那么有效。下图展示了这些段以及我们例子中的变量:


You can examine the memory areas in a Linux process by reading the file /proc/pid_of_process/maps. Keep in mind that a segment may contain many areas. For example, each memory mapped file normally has its own area in the mmap segment, and dynamic libraries have extra areas similar to BSS and data. The next post will clarify what ‘area’ really means. Also, sometimes people say “data segment” meaning all of data + bss + heap.
你可以通过阅读文件/proc/pid_of_process/maps来检验一个Linux进程中的内存区域。记住一个段可能包含许多区域。比如,每个内存映射文件在mmap段中都有属于自己的区域,动态库拥有类似BSS和数据段的额外区域。下一篇文章讲说明这些“区域”(area)的真正含义。有时人们提到“数据段”,指的就是全部的数据段 + BSS + 堆。


You can examine binary images using the nm and objdump commands to display symbols, their addresses, segments, and so on. Finally, the virtual address layout described above is the “flexible” layout in Linux, which has been the default for a few years. It assumes that we have a value forRLIMIT_STACK. When that’s not the case, Linux reverts back to the “classic” layout shown below:
你可以通过nmobjdump命令来察看二进制镜像,打印其中的符号,它们的地址,段等信息。最后需要指出的是,前文描述的虚拟地址布局在Linux 中是一种“灵活布局”(flexible layout),而且以此作为默认方式已经有些年头了。它假设我们有值 RLIMIT_STACK。当情况不是这样时, Linux 退回使用“经典布局”(classic layout),如下图所示:


That’s it for virtual address space layout. The next post discusses how the kernel keeps track of these memory areas. Coming up we’ll look at memory mapping, how file reading and writing ties into all this and what memory usage figures mean.
对虚拟地址空间的布局就讲这些吧。下一篇文章将讨论内核是如何跟踪这些内存区域的。我们会分析内存映射,看看文件的读写操作是如何与之关联的,以及内存使用概况的含义。


原文标题:Anatomy of a Program in Memory
原文地址:http://duartes.org/gustavo/blog/

翻译者:http://blog.csdn.net/drshenlei/archive/2009/07/11/4339110.aspx


2012年1月19日星期四

翻译:How The Kernel Manages Your Memory

最近发现Gustavo Duarte的blog上Best of系列的文章,其内容大多涉及linux内核管理和虚拟内存,但是又能以浅显易容的方式展现出来,因此我想把它们翻译出来,跟大家分享。

没有按照原blog上的顺序,读了哪篇就翻译哪篇。今天翻译 How The Kernel Manages Your Memory. 为了大家便于理解,我在这里贴出原文内容,采用一段英文一段中文的方式来翻译。


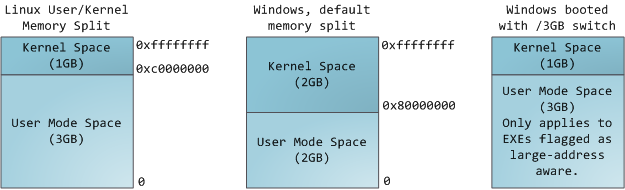
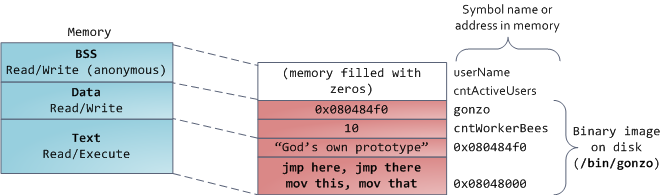
After examining the virtual address layout of a process, we turn to the kernel and its mechanisms for managing user memory. Here is gonzo again:
在学习完进程的虚拟空间布局后,我们转过来看看内核和进程内存管理的机制。这里仍然以gonzo为例:

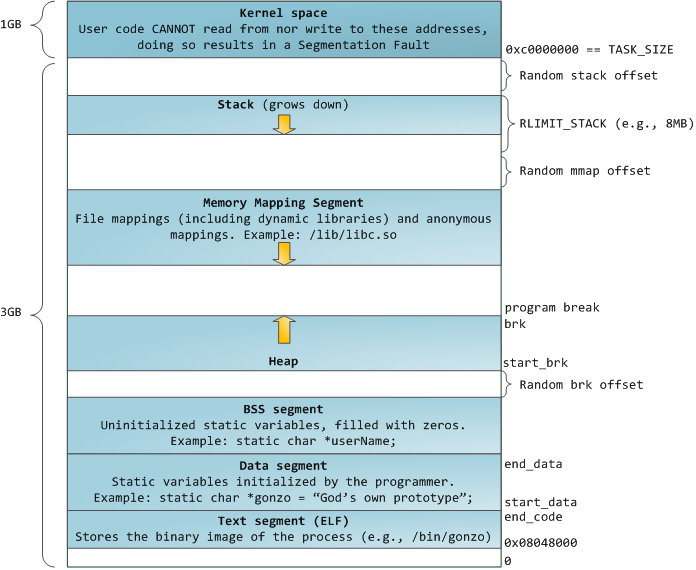
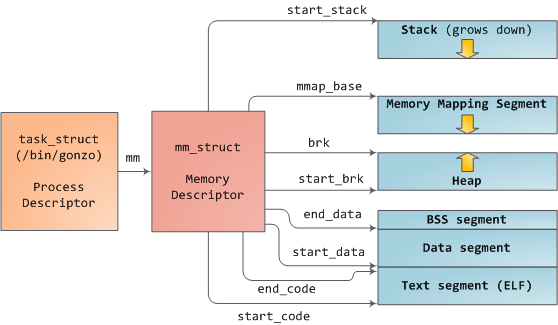
Linux processes are implemented in the kernel as instances of task_struct, the process descriptor. The mm field in task_struct points to the memory descriptormm_struct, which is an executive summary of a program’s memory. It stores the start and end of memory segments as shown above, the number of physical memory pages used by the process (rss stands for Resident Set Size), the amount of virtual address space used, and other tidbits. Within the memory descriptor we also find the two work horses for managing program memory: the set of virtual memory areas and the page tables. Gonzo’s memory areas are shown below:
内核把进程表示为 task_struct 结构体的实例,即进程描述符。其mm字段指向一个 mm_struct 结构体,即存储描述符,它描述了进程使用内存的一个概况。如上图所示。下图显示了Gonzo进程的内存区域:


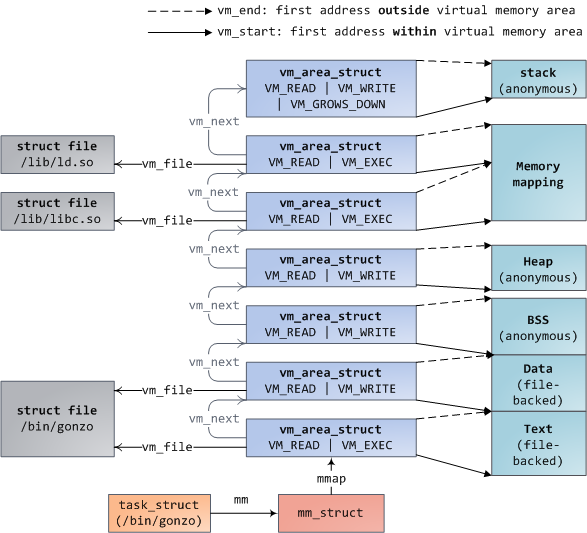
Each virtual memory area (VMA) is a contiguous range of virtual addresses; these areas never overlap. An instance of vm_area_struct fully describes a memory area, including its start and end addresses, flags to determine access rights and behaviors, and the vm_file field to specify which file is being mapped by the area, if any. A VMA that does not map a file is anonymous. Each memory segment above (e.g., heap, stack) corresponds to a single VMA, with the exception of the memory mapping segment. This is not a requirement, though it is usual in x86 machines. VMAs do not care which segment they are in.
结构体 vm_area_struct (VMA)表示一段连续的虚拟地址,VMA地址间不会相互重叠。VMA记录了虚拟地址段的开始地址和结束地址,访问权限和行为标记,如果有文件映射到该段,那么vm_file字段就指向被映射的文件。没有文件映射的VMA是匿名VMA。从上图可以看到,Text段和BSS段有文件映射,其VMA不是匿名的。Data段,Heap段和Stack段没有文件映射,其VMA是匿名的。每个虚地址段对应一个VMA,但Memory Mapping段例外。

A program’s VMAs are stored in its memory descriptor both as a linked list in the mmap field, ordered by starting virtual address, and as a red-black tree rooted at the mm_rb field. The red-black tree allows the kernel to search quickly for the memory area covering a given virtual address. When you read file /proc/pid_of_process/maps, the kernel is simply going through the linked list of VMAs for the process and printing each one.
mm_struct结构体的mmap字段指向进程VMA组成的链表,以VMA起始地址做升序排列。同时它的 mm_rb 字段指向VMA组成的一棵红黑树,红黑树使内核能够迅速找到包含某虚地址的VMA。当你查看进程文件 /proc/pid/maps 时,内核只是遍历VMA链表并依次输出。

In Windows, the EPROCESS block is roughly a mix of task_struct and mm_struct. The Windows analog to a VMA is the Virtual Address Descriptor, or VAD; they are stored in an AVL tree. You know what the funniest thing about Windows and Linux is? It’s the little differences.
Windows系统中,EPROCESS 结构体基本上是 task_struct 和 mm_struct 的大杂烩。VMA在Windows中的等价物是虚拟地址描述符(VAD),以AVL树存储。知道Windows和Linux最有趣的事情么?是它们之间的一点点小差别。


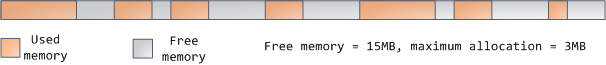
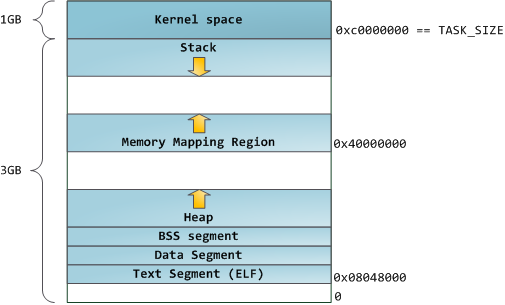
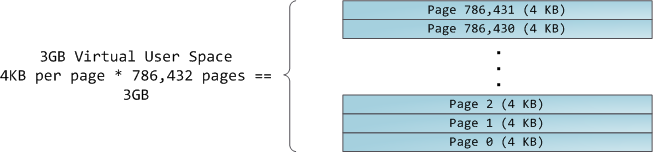
The 4GB virtual address space is divided into pages. x86 processors in 32-bit mode support page sizes of 4KB, 2MB, and 4MB. Both Linux and Windows map the user portion of the virtual address space using 4KB pages. Bytes 0-4095 fall in page 0, bytes 4096-8191 fall in page 1, and so on. The size of a VMA must be a multiple of page size. Here’s 3GB of user space in 4KB pages:
内核把4GB虚地址空间分割为,或逻辑页,32位模式的x86处理器支持4KB,2MB和4MB的页大小。Windows和Linux都使用4KB的页大小。VMA描述的虚地址范围包含若干个page。下图显示了3G用户空间的page:


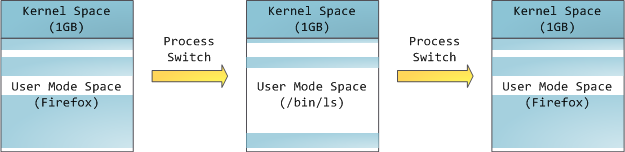
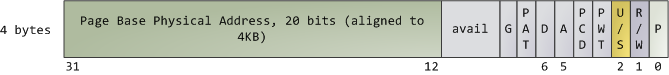
The processor consults page tables to translate a virtual address into a physical memory address. Each process has its own set of page tables; whenever a process switch occurs, page tables for user space are switched as well. Linux stores a pointer to a process’ page tables in the pgd field of the memory descriptor. To each virtual page there corresponds one page table entry (PTE) in the page tables, which in regular x86 paging is a simple 4-byte record shown below:
处理器访问页表把虚地址转换到物理地址,每个进程有自己的页表。当进程切换时,用户空间的页表也随之切换。Linux把页表地址存储在 mm_struct 结构体内名为 pgd 的指针内。页表内每个页表项(PTE)记录一个逻辑页。对于x86处理器,页表项大小为4B:


Linux has functions to read and set each flag in a PTE. Bit P tells the processor whether the virtual page is present in physical memory. If clear (equal to 0), accessing the page triggers a page fault. Keep in mind that when this bit is zero, the kernel can do whatever it pleases with the remaining fields. The R/W flag stands for read/write; if clear, the page is read-only. Flag U/S stands for user/supervisor; if clear, then the page can only be accessed by the kernel. These flags are used to implement the read-only memory and protected kernel space we saw before.
Linux有函数可以读写PTE中的标记位。P位表明逻辑页是否存在物理内存,0表示不在物理内存,此时访问该页将触发page fault。当该位为0,内核可以对其他字段为所欲为。R/W位代表读写权限,0表示只读。U/S位代表用户或内核,0表示该页只能被内核访问。这些位组合起来实现了我们前面说过的读写权限和内核空间保护。
Bits D and A are for dirty and accessed. A dirty page has had a write, while an accessed page has had a write or read. Both flags are sticky: the processor only sets them, they must be cleared by the kernel. Finally, the PTE stores the starting physical address that corresponds to this page, aligned to 4KB. This naive-looking field is the source of some pain, for it limits addressable physical memory to 4 GB. The other PTE fields are for another day, as is Physical Address Extension.
D位表示是否脏页,脏页是被修改过的页。A位代表访问位,表示是否有过对该页的读写操作。这两个位都是有粘性的,只能被处理器置位,并且只能由内核来清除。最后,PTE还保存了该页对应的起始物理地址,以4KB对齐。至于剩下的字段,过些天我介绍物理地址扩展的时候再说。
A virtual page is the unit of memory protection because all of its bytes share the U/S and R/W flags. However, the same physical memory could be mapped by different pages, possibly with different protection flags. Notice that execute permissions are nowhere to be seen in the PTE. This is why classic x86 paging allows code on the stack to be executed, making it easier to exploit stack buffer overflows (it’s still possible to exploit non-executable stacks using return-to-libc and other techniques). This lack of a PTE no-execute flag illustrates a broader fact: permission flags in a VMA may or may not translate cleanly into hardware protection. The kernel does what it can, but ultimately the architecture limits what is possible.
逻辑页是内存保护的最小单元,多个逻辑页可以映射到同一个物理页,但保护标记可能不同。请注意,在页表项里没有执行权限标记,这就是为什么x86分页允许在stack段存放可执行代码并执行的原因。(译者注:其实,JVM的JIT编译器就是这么干的。)

Virtual memory doesn’t store anything, it simply maps a program’s address space onto the underlying physical memory, which is accessed by the processor as a large block called thephysical address space. While memory operations on the bus are somewhat involved, we can ignore that here and assume that physical addresses range from zero to the top of available memory in one-byte increments. This physical address space is broken down by the kernel intopage frames. The processor doesn’t know or care about frames, yet they are crucial to the kernel because 
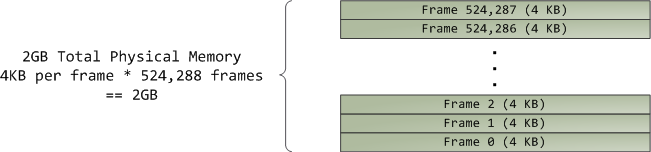
the page frame is the unit of physical memory management. Both Linux and Windows use 4KB page frames in 32-bit mode; here is an example of a machine with 2GB of RAM:
逻辑空间无法保存任何东西,它只是把进程的逻辑空间映射到处理器可以访问的物理空间。尽管总线对于地址的解析有些复杂,我们仍可以简单地认为物理地址空间从0开始,以1Byte递增到达可用内存的极限。物理地址空间被内核划分为page frame(页帧)。处理器并不知道也不关心页帧,但它对于内核却至关重要,因为页帧是物理内存管理的基本单元。32位模式下的Linux和Windows都使用4kB大小的页帧(和逻辑页大小一致)。下面是一个有2GB RAM的机器:


In Linux each page frame is tracked by a descriptor and several flags. Together these descriptors track the entire physical memory in the computer; the precise state of each page frame is always known. Physical memory is managed with the buddy memory allocation technique, hence a page frame is free if it’s available for allocation via the buddy system. An allocated page frame might be anonymous, holding program data, or it might be in the page cache, holding data stored in a file or block device. There are other exotic page frame uses, but leave them alone for now. Windows has an analogous Page Frame Number (PFN) database to track physical memory.
在Linux系统,页帧由一个描述符和一组标记位来跟踪。描述符精确地记录了物理内存的状况。所有这些描述符一起追踪了整个物理内存的使用状况。管理物理内存时使用了buddy memory allocation技术。已分配的页帧可能是匿名的,保存了程序数据,也可能用作page cache,保存文件或者块设备的数据。还有其他一些很奇特的页帧使用方式,不过现在不用去管。Windows也有类似的页帧号(PFN)来追踪物理内存。


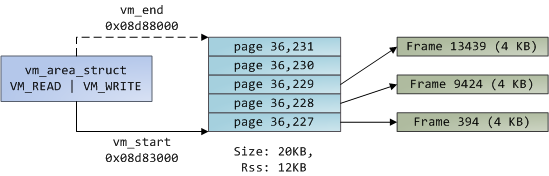
Let’s put together virtual memory areas, page table entries and page frames to understand how this all works. Below is an example of a user heap:
现在,让我们把虚地址段(VMA),页表项和页帧放在一起,来理解虚拟内存是如何工作的。下面是一个用户空间堆的例子:


Blue rectangles represent pages in the VMA range, while arrows represent page table entries mapping pages onto page frames. Some virtual pages lack arrows; this means their corresponding PTEs have the Present flag clear. This could be because the pages have never been touched or because their contents have been swapped out. In either case access to these pages will lead to page faults, even though they are within the VMA. It may seem strange for the VMA and the page tables to disagree, yet this often happens.
最左边是堆对应的VMA,中间大的蓝色方框是进程的页表,包含很多页表项。最右边的绿色方框表示物理页帧。它们之间的箭头表示逻辑页到物理页帧的映射关系。还有一些逻辑页没有箭头,这表示页表项的P位为0,有可能因为该页从来没有被访问过,或者物理页帧被换出到swap。此时访问该逻辑页将导致page fault(缺页故障).
A VMA is like a contract between your program and the kernel. You ask for something to be done (memory allocated, a file mapped, etc.), the kernel says “sure”, and it creates or updates the appropriate VMA. But it does not actually honor the request right away, it waits until a page fault happens to do real work. The kernel is a lazy, deceitful sack of scum; this is the fundamental principle of virtual memory. It applies in most situations, some familiar and some surprising, but the rule is that VMAs record what has been agreed upon, while PTEs reflect what has actually been done by the lazy kernel. These two data structures together manage a program’s memory; both play a role in resolving page faults, freeing memory, swapping memory out, and so on. Let’s take the simple case of memory allocation:
VMA就好比你和内核间的契约,你请求完成一些操作(内存分配,文件映射,等等),内核说“没问题”,然后创建或者更新相应的VMA,但它并没有把你的请求放在心上,而是一直等到缺页故障发生时才去执行请求。内核就好像是一个又懒又诡计多端的人渣。以上就是虚拟内存的基本原理。它适用于大多数场景,有些你熟悉,有些令你吃惊,但规则是VMA记录程序和内核达成的协议,而页表反映懒惰的内核真正做了哪些。这两个数据结构共同管理着进程的内存,共同解决缺页故障,释放内存,换入换出内存等操作。让我们来看一个内存分配的简单场景:

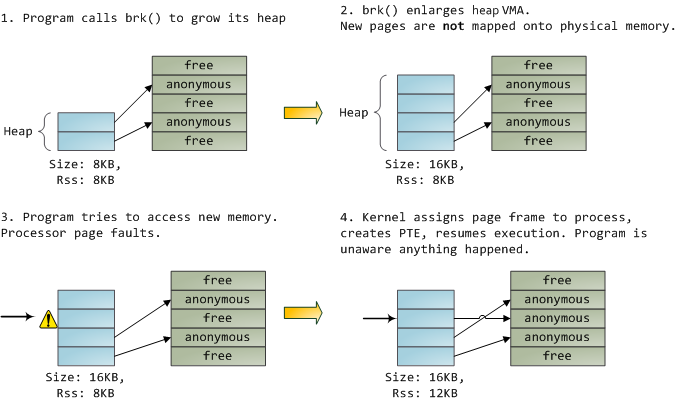
When the program asks for more memory via the brk() system call, the kernel simply updates the heap VMA and calls it good. No page frames are actually allocated at this point and the new pages are not present in physical memory. Once the program tries to access the pages, the processor page faults and do_page_fault() is called. It searches for the VMA covering the faulted virtual address using find_vma(). If found, the permissions on the VMA are also checked against the attempted access (read or write). If there’s no suitable VMA, no contract covers the attempted memory access and the process is punished by Segmentation Fault.
当程序执行 brk() 系统调用请求更多内存,内核只是更新堆的VMA,并没有真的分配页帧。一旦程序试图访问新创建的逻辑页,处理器会报缺页故障,并执行 do_page_fault() 方法。该方法又调用 find_vma() 方法来找到逻辑地址所在的VMA,如果找到了,内核会对比VMA上的访问权限和要执行的操作(读或写)。如果没找到VMA,说明程序和内核没有达成该地址的契约,那么进程会受到段错误的惩罚。

When a VMA is found the kernel must handle the fault by looking at the PTE contents and the type of VMA. In our case, the PTE shows the page is not present. In fact, our PTE is completely blank (all zeros), which in Linux means the virtual page has never been mapped. Since this is an anonymous VMA, we have a purely RAM affair that must be handled by do_anonymous_page(), which allocates a page frame and makes a PTE to map the faulted virtual page onto the freshly allocated frame.
找到VMA后,内核会继续找到逻辑地址所在的页表项,在本例,页表项是完全空白的,表明该逻辑页还没有映射到物理页帧。因为要访问的内存段是匿名的,内核必须调用 do_anonymous_page() 方法,分配物理页帧,并把它映射到出错的逻辑页,记录在页表项里。

Things could have been different. The PTE for a swapped out page, for example, has 0 in the Present flag but is not blank. Instead, it stores the swap location holding the page contents, which must be read from disk and loaded into a page frame by do_swap_page() in what is called a major fault.
对于交换出去的页,其页表项的P标记位为0,地址字段则指向存放页内容的swap位置。访问这样的页会引发 major fault ,通过调用 do_swap_page() 从磁盘读取内容,保存在物理页帧。而应用程序对此一无所知。

This concludes the first half of our tour through the kernel’s user memory management. In the next post, we’ll throw files into the mix to build a complete picture of memory fundamentals, including consequences for performance.
到这里我们已经走过了内核内存管理之旅的前半部分旅程,在下一篇文章中,我要把文件也加进来,构建一副完整的内存管理画面,以及对性能的后果。