
<bean id="myth-web_properties" class="org.springframework.beans.factory.config.PropertiesFactoryBean">
<property name="locations">
<list>
<value>classpath:META-INF/mythcore-dal.properties</value>
<value>classpath:META-INF/mythcore-framework.properties</value>
<value>classpath:META-INF/mythcore-biz.properties</value>
<value>classpath:META-INF/myth-biz.properties</value>
<value>classpath:META-INF/myth-web-shared.properties</value>
<value>classpath:META-INF/myth-web.properties</value>
<value>classpath:maven.properties</value>
<value>classpath:META-INF/mythcore-loan.properties</value>
<value>classpath:META-INF/mythcore-batch.properties</value>
</list>
</property>
</bean>
PropertiesFactoryBean从指定的Resource加载properties文件,生成Properties对象作为spring配置中占位符的数据来源。
上面例子中的配置数据来自classpath,web应用的classpath路径是WEB-INF/lib下的所有jar,还有WEB-INF/classes目录。也就是说配置数据都是来自jar包和classes目录内。
spring除了ClassPathResource外还有FileSystemResource。我们可以利用它来加载在war包外的配置数据。
另外,指定资源路径的时候还可以使用pattern方式,也就是在资源路径中使用通配符。
public static void main(String[] args) throws IOException {
PathMatchingResourcePatternResolver patternResolver = new PathMatchingResourcePatternResolver();
Resource[] res = patternResolver.getResources("file:/d:/program/**/*.zip");
}
2013年12月19日星期四
2012年8月10日星期五
clojure基本知识记录
最近在学习clojure,一种JVM上的lisp方言。在这里记录一下clojure的基本知识。
======================================
======================================
symbol
  符号绑定到不可变值。可理解为引用。
  Clojure没有变量。
  (symbol? aaa) 判断是否是符号

list
  形式
  用途:
    函数调用
 macro
 special form

list
  list (list 1 2 3)
  语法糖 '(1 2 3)
  first (first '(1 2 3)) => 1
  rest (rest '(1 2 3)) => (2 3)

vector
  [1 2 "three"]
  下标求值  ([7 8 9] 2) => 9
  vector自己作为运算符

map
  {"a" 1, "b" 2, "c" "aaa"}
  按key求值  (get {"a" 1, "b" 2, "c" "aaa"} "c") => "aaa"
  语法糖 ({"a" 1, "b" 2, "c" "aaa"} "c") => "aaa"
  第三种形式 (:a {:a 1, :b 2, :c 3}) => 1

def
  bind symbol to value
  clojure没有变量,但是symbol的绑定可以修改。
  (def x 5) => #'JiurenTest/x
  x => 5
  (def x 9) => #'JiurenTest/x
  x => 9

defn = def + fn
  定义函数 (defn add1
             [x]
             (+ x 1))
  函数名是一个symbol
  参数列表是一个vector
  defn是一个macro. def + fn
  正规形式,(def funcName
              (fn [argList...]
       (body)))
  fn定义匿名函数,lambda函数

  (fn? +) => true 判断是否是函数
  (fn? add1) => true   add1函数作为fn?的参数
  (fn? fn?) => true

doc
  查看doc  (doc xxx)
  返回值nil,输出是副作用。
  (defn add1
    "add argument by one"
    [x]
    (+ x 1))

str
  创建string的函数
  (fn? str) => true
  (str) => ""
  (str xxx) 类似于 xxx.toString()
  (str +) => "clojure.core$_PLUS_@14627a"
  (str 1 2) => "12"  拼接

if
  (if true "yes") => "yes"
  (if false "yes") => nil   else分支默认值为nil
  (if (= 1 2) 5 10) => 10
  (if 0 true) => true
  (if "" true) => true
  (if nil "yes" "no") => "no"
  非boolean值转boolean值,nil转为false,其他转为true

do
  顺序执行 (do (expression)*)  返回最后一个表达式的值
  (do (println "Hello.") (+ 2 2))
    Hello.
 4

when
  没有else分支。if分支可以有多个expression
  when是一个宏。when = if + do
  (when true 1 2 3) => 3
  (when false 1 2 3) => nil

let
  创建临时symbol。类似于局部变量。
  (fn? let) 发现let貌似也是一个宏。???
  (let [x 2] (+ x 8)) => 10
  (let [x 2 y 8] (= (+ x y) 10)) => true

loop
  (loop [bindings*] exprs*)
  和let只有一点不同,在开始处设置了回归点。see recur.
  也就是说,如果内部没有recur的话,就没有循环。
  (loop [i 0]
    (when (< i 5)
   (println "i:" i)
   (inc i)))
  => 1
  输出:
  i: 0

recur
  (recur exprs*)  exprs个数和loop中的bindings个数相同
  Evaluates the exprs in order, then, in parallel, rebinds the bindings of the recursion point to the values of the exprs. If the recursion point was a fn method, then it rebinds the params. If the recursion point was a loop, then it rebinds the loop bindings. Execution then jumps back to the recursion point.

  Note that recur is the only non-stack-consuming looping construct in Clojure. There is no tail-call optimization and the use of self-calls for looping of unknown bounds is discouraged. recur is functional and its use in tail-position is verified by the compiler.

  计算 + 重新绑定 + goto
  (loop [i 0]
    (when (< i 5)
   (println "i:" i)
   (recur (inc i))))
  => nil
  输出:
    i: 0
    i: 1
    i: 2
    i: 3
    i: 4

  从后向前
  (defn factorial [n]
    (loop [i n acc 1]
   (if (= i 1)
     acc
  (recur (dec i) (* i acc)))))
  从前向后
  (defn factorial2 [n]
    (loop [i 2 acc 1]
   (if (> i n)
     acc
  (recur (inc i) (* i acc)))))

sequence
  Seqs differ from iterators in that they are persistent and immutable, not stateful cursors into a collection.

发现
  高阶函数体现出: code as data
  clojure的expression都是嵌套的,因此执行过程是栈式的。
2012年5月10日星期四
FileOutputStream internals
最近了解到linux上的IO库函数都是用了缓冲,分为行缓冲与全缓冲。缓冲满了才真正做系统调用。
参考:
http://stackoverflow.com/questions/8509700/c-standard-i-o-vs-unix-i-o-basics
http://www.groad.net/bbs/simple/?t3582.html
由此联想到java的FileOutputStream是如何做的呢?他的native代码是否也调用libc来实现的?如果是的话,应该也使用到了行缓冲。于是我写了一个代码来验证。
运行后通过strace观察系统调用。strace -p pid -f -tt -o Test.strace.
1195 14:31:55.405610 write(9, "n", 1 <unfinished ...>
1195 14:31:55.405663 <... write resumed> ) = 1
1195 14:31:55.409621 write(9, "i", 1) = 1
1195 14:31:55.412765 write(9, "h", 1) = 1
1195 14:31:55.416848 write(9, "a", 1) = 1
1195 14:31:55.420989 write(9, "o", 1) = 1
1195 14:31:55.424093 write(9, "\n", 1) = 1
1195 14:31:55.427213 write(9, "n", 1) = 1
1195 14:31:55.430317 write(9, "i", 1) = 1
1195 14:31:55.433394 write(9, "h", 1) = 1
1195 14:31:55.436508 write(9, "a", 1) = 1
1195 14:31:55.439966 write(9, "o", 1) = 1
1195 14:31:55.443733 write(9, "\n", 1) = 1
1195 14:31:55.447882 write(9, "n", 1) = 1
结果说明FileOutputStream的native代码没有做任何缓冲,而是直接调用了os的write函数。
参考:
http://stackoverflow.com/questions/8509700/c-standard-i-o-vs-unix-i-o-basics
http://www.groad.net/bbs/simple/?t3582.html
由此联想到java的FileOutputStream是如何做的呢?他的native代码是否也调用libc来实现的?如果是的话,应该也使用到了行缓冲。于是我写了一个代码来验证。
// Test.javaimport java.io.File;import java.io.FileOutputStream;public class Test {public static void main(String[] args) throws Exception {File file = File.createTempFile("aaa", ".bbb");FileOutputStream fout = new FileOutputStream(file);for (;;) {fout.write('n');fout.write('i');fout.write('h');fout.write('a');fout.write('o');fout.write('\n');}}}
运行后通过strace观察系统调用。strace -p pid -f -tt -o Test.strace.
1195 14:31:55.405610 write(9, "n", 1 <unfinished ...>
1195 14:31:55.405663 <... write resumed> ) = 1
1195 14:31:55.409621 write(9, "i", 1) = 1
1195 14:31:55.412765 write(9, "h", 1) = 1
1195 14:31:55.416848 write(9, "a", 1) = 1
1195 14:31:55.420989 write(9, "o", 1) = 1
1195 14:31:55.424093 write(9, "\n", 1) = 1
1195 14:31:55.427213 write(9, "n", 1) = 1
1195 14:31:55.430317 write(9, "i", 1) = 1
1195 14:31:55.433394 write(9, "h", 1) = 1
1195 14:31:55.436508 write(9, "a", 1) = 1
1195 14:31:55.439966 write(9, "o", 1) = 1
1195 14:31:55.443733 write(9, "\n", 1) = 1
1195 14:31:55.447882 write(9, "n", 1) = 1
结果说明FileOutputStream的native代码没有做任何缓冲,而是直接调用了os的write函数。
2012年2月29日星期三
常用代码:EventDispatcher
import java.util.HashMap;
import java.util.List;
import java.util.Map;
import java.util.concurrent.CopyOnWriteArrayList;
public class EventDispatcher {
public EventDispatcher() {
listenerMap = new HashMap<Class<? extends ClientEvent>, CopyOnWriteArrayList<ClientEventListener>>();
}
/**
* 添加事件监听器
*
* @param listener
*/
public void addEventListener(ClientEventListener listener) {
List<ClientEventListener> listenerList = getListenerList(listener.interest());
if (!listenerList.contains(listener)) {
listenerList.add(listener);
}
}
/**
* 把事件监听器添加在所属列表的指定位置。
*/
public void addEventListener(ClientEventListener listener, int idx) {
List<ClientEventListener> listeners = getListenerList(listener.interest());
if (!listeners.contains(listener)) {
listeners.add(idx, listener);
}
}
List<ClientEventListener> getListenerList(
Class<? extends ClientEvent> eventType) {
CopyOnWriteArrayList<ClientEventListener> listeners = listenerMap.get(eventType);
if (null == listeners) {
listeners = new CopyOnWriteArrayList<ClientEventListener>();
listenerMap.put(eventType, listeners);
}
return listeners;
}
/**
* 发布client事件。
*/
public void fireEvent(ClientEvent event) {
CopyOnWriteArrayList<ClientEventListener> listeners = listenerMap.get(event.getClass());
if (null != listeners) {
for (ClientEventListener listener : listeners) {
try {
listener.onClientEvent(event);
} catch (Exception e) {
// TODO
}
}
}
}
// ========================
private final Map<Class<? extends ClientEvent>, CopyOnWriteArrayList<ClientEventListener>> listenerMap;
// ========================
/**
* Client事件。
*/
static public abstract class ClientEvent {
}
/**
* Client事件监听器。
*/
static public abstract class ClientEventListener {
/**
* 感兴趣的事件类型
*/
abstract public Class<? extends ClientEvent> interest();
/**
* 处理事件
* @param event
*/
abstract public void onClientEvent(ClientEvent event);
}
}
2012年2月9日星期四
翻译:主板芯片以及地址映射
原作者:Gustavo Duarte
原标题:Motherboard Chipsets and the Memory Map
I’m going to write a few posts about computer internals with the goal of explaining how modern kernels work. I hope to make them useful to enthusiasts and programmers who are interested in this stuff but don’t have experience with it. The focus is on Linux, Windows, and Intel processors. Internals are a hobby for me, I have written a fair bit of kernel-mode code but haven’t done so in a while. This first post describes the layout of modern Intel-based motherboards, how the CPU accesses memory and the system memory map.
我准备写一个系列文章,来解释现代操作系统内核是如何工作的。希望对这块内容感兴趣却没有多少经验的爱好者和程序员有所帮助。文章的焦点是Linux,Windows和Intel处理器。我喜欢了解内幕,我曾经写过一些内核态的代码,但没做过多久。该系列第一篇文章描述了基于Intel处理器的主板布局,CPU如何访问地址,以及主板对地址的映射。
To start off let’s take a look at how an Intel computer is wired up nowadays. The diagram below shows the main components in a motherboard and dubious color taste:
最开始,我们来看看目前基于Intel处理器的计算机,下图显示了主板内的主要组成部分:
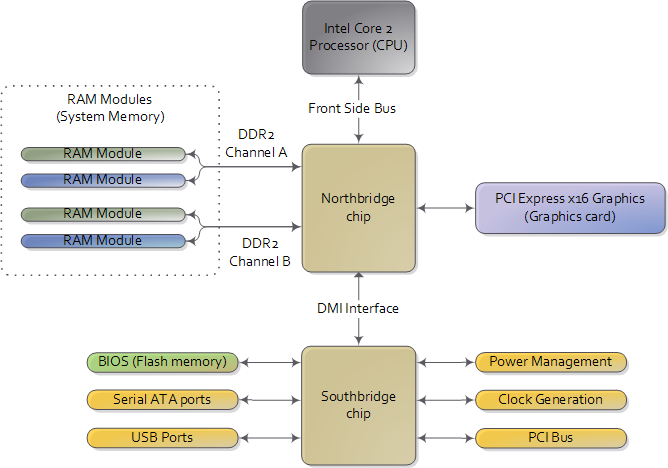
In a motherboard the CPU’s gateway to the world is the front-side bus connecting it to the northbridge. Whenever the CPU needs to read or write memory it does so via this bus. It uses some pins to transmit the physical memory address it wants to write or read, while other pins send the value to be written or receive the value being read. An Intel Core 2 QX6600 has 33 pins to transmit the physical memory address (so there are 233 choices of memory locations) and 64 pins to send or receive data (so data is transmitted in a 64-bit data path, or 8-byte chunks). This allows the CPU to physically address 64 gigabytes of memory (233 locations * 8 bytes) although most chipsets only handle up to 8 gigs of RAM.
前端总线作为CPU的门卫与北桥芯片相连。任何时候,CPU需要读或写存储器,都要经过前端总线。CPU使用一些管线传输物理地址,另外一些管线用来写出数据或读入数据。Intel Core 2 QX6600处理器有33根地址管线(因此共有233个地址),和64根数据管线。
原标题:Motherboard Chipsets and the Memory Map
I’m going to write a few posts about computer internals with the goal of explaining how modern kernels work. I hope to make them useful to enthusiasts and programmers who are interested in this stuff but don’t have experience with it. The focus is on Linux, Windows, and Intel processors. Internals are a hobby for me, I have written a fair bit of kernel-mode code but haven’t done so in a while. This first post describes the layout of modern Intel-based motherboards, how the CPU accesses memory and the system memory map.
我准备写一个系列文章,来解释现代操作系统内核是如何工作的。希望对这块内容感兴趣却没有多少经验的爱好者和程序员有所帮助。文章的焦点是Linux,Windows和Intel处理器。我喜欢了解内幕,我曾经写过一些内核态的代码,但没做过多久。该系列第一篇文章描述了基于Intel处理器的主板布局,CPU如何访问地址,以及主板对地址的映射。
To start off let’s take a look at how an Intel computer is wired up nowadays. The diagram below shows the main components in a motherboard and dubious color taste:
最开始,我们来看看目前基于Intel处理器的计算机,下图显示了主板内的主要组成部分:
现代的主板,北桥芯片和南桥芯片构成芯片组。
As you look at this, the crucial thing to keep in mind is that the CPU doesn’t really know anything about what it’s connected to. It talks to the outside world through its pins but it doesn’t care what that outside world is. It might be a motherboard in a computer but it could be a toaster, network router, brain implant, or CPU test bench. There are three main ways by which the CPU and the outside communicate: memory address space, I/O address space, and interrupts. We only worry about motherboards and memory for now.
要记住的最重要的事情是,CPU并不知道跟它相连的是什么东西。CPU通过管脚(pin)与外界交谈,但是它对外面的世界并不了解:可能是计算机主板,但也可能是一个烤面包机,网络路由器,一个植入大脑的芯片,或是CPU测试台。CPU通过三种主要方式与外界通信:存储地址,IO地址和中断。现在我们只关注主板和存储地址。
In a motherboard the CPU’s gateway to the world is the front-side bus connecting it to the northbridge. Whenever the CPU needs to read or write memory it does so via this bus. It uses some pins to transmit the physical memory address it wants to write or read, while other pins send the value to be written or receive the value being read. An Intel Core 2 QX6600 has 33 pins to transmit the physical memory address (so there are 233 choices of memory locations) and 64 pins to send or receive data (so data is transmitted in a 64-bit data path, or 8-byte chunks). This allows the CPU to physically address 64 gigabytes of memory (233 locations * 8 bytes) although most chipsets only handle up to 8 gigs of RAM.
前端总线作为CPU的门卫与北桥芯片相连。任何时候,CPU需要读或写存储器,都要经过前端总线。CPU使用一些管线传输物理地址,另外一些管线用来写出数据或读入数据。Intel Core 2 QX6600处理器有33根地址管线(因此共有233个地址),和64根数据管线。
2012年1月29日星期日
JAVA程序的性能瓶颈
常见的性能瓶颈
- CPU:
- 内存:频繁的ygc和fgc
- 异常:程序不断处理异常信息
- 同步:程序等待共享资源被释放
- 本地IO和网络IO:等待数据读写到磁盘或网络,或者数据库操作
系统性能与调优的关系
Ø调优的作用:在当前的系统基础上,找出性能(内存)瓶颈点,寻找解决方案(二八规则:百分二十以下的代码消耗了80%的系统性能)
Ø系统性能:一个高性能的应用不是靠后期调优调出来的。以下要素必不可少:
l一个正确的总体设计策略;
lJava编码技巧,遵循java编码规范;
l编码完成后对应用关键点的调优;
问题在哪里
l性能:哪些方法被调用消耗Cpu时间最多;因素有两个
n单次运行耗时
n方法在应用服务时的运行次数
l内存:内存中的对象主要是哪些,数量有多少;
n内存常驻对象;
n方法体中生成的运行期对象;
找到原因
Ø找出系统数据(内存消耗分布、代码Cpu耗时比例…)后进行针对的代码分析,看是否是正常的消耗。
Ø工具能够引导你把注意力集中到关键点上,但系统调优是否有效还在于你在分析对应点的代码后,是否能够找到更好的解决方案。
Ø性能跟踪工具仅仅是一个度量工具,最宝贵的还是你的头脑,技术上的思路&对业务的熟悉度。
Ø仔细读代码,代码是否有问题!有没有不必要的开销
Ø认真分析业务,看有没有其他的实现方式
制定对策
Ø集中力量优化占用80%性能、内存的代码段
Ø优化后,系统性能瓶颈会发生转变(性能开销比例发生变化),需要重新采集数据
案例
ØList页面的调优,页面展示会是一个大问题,Url的渲染!
l大量链接的渲染,通过建立一个链接渲染工具来实现(建立参数基准),生成时从内部缓存快速拼接生成;
Ø大量内存中的缓存对象: 性能与内存占用的权衡
lObject – 成员变量的类型 尽量使用简单类型
l不要建立空的容器对象 list<***>
2012年1月20日星期五
Linux性能监控命令
CPU监控
内存监控
total = used + free
used = AppUsed + buffers + cachedbuffers 表示块设备读写缓冲区大小。
cached 表示文件系统缓存大小。
第三行第一个字段,表示 used-buffer-cache,也就是被应用使用掉的物理内存大小。第二个字段,表示free+cache+buffer,也就是还可以被应用程序挪用的物理内存大小。
IO监控
这里再说明一下iostat的输出。svctm是service time的缩写,表示块设备处理请求耗时。await字段是请求被处理前的等待时间。
avg-cpu: %user %nice %system %iowait %steal %idle
9.43 0.00 0.56 0.00 0.00 90.01
Device: rrqm/s wrqm/s r/s w/s rsec/s wsec/s avgrq-sz avgqu-sz await svctm %util
sda 0.00 0.00 0.00 0.00 0.00 0.00 0.00 0.00 0.00 0.00 0.00
sda1 0.00 0.00 0.00 0.00 0.00 0.00 0.00 0.00 0.00 0.00 0.00
sda2 0.00 0.00 0.00 0.00 0.00 0.00 0.00 0.00 0.00 0.00 0.00
sda3 0.00 0.00 0.00 0.00 0.00 0.00 0.00 0.00 0.00 0.00 0.00
sda4 0.00 0.00 0.00 0.00 0.00 0.00 0.00 0.00 0.00 0.00 0.00
sda5 0.00 0.00 0.00 0.00 0.00 0.00 0.00 0.00 0.00 0.00 0.00
sda6 0.00 0.00 0.00 0.00 0.00 0.00 0.00 0.00 0.00 0.00 0.00
sda7 0.00 0.00 0.00 0.00 0.00 0.00 0.00 0.00 0.00 0.00 0.00
sda8 0.00 0.00 0.00 0.00 0.00 0.00 0.00 0.00 0.00 0.00 0.00
sda9 0.00 0.00 0.00 0.00 0.00 0.00 0.00 0.00 0.00 0.00 0.00
使用strace监控java进程
监控java这样一般启动多线程的进程,简单的strace -p pid什么也看不到。需要增加 -f 这个参数,man上说这个参数的意思是监控该进程及其子进程。
strace -f -p pid
统计syscall的调用次数和耗时
strace -f -p 27847 -c
% time seconds usecs/call calls errors syscall
------ ----------- ----------- --------- --------- ----------------
66.10 6.520408 2443 2669 547 futex
33.35 3.289478 534 6162 epoll_wait
0.46 0.044990 1730 26 poll
0.03 0.002859 0 8526 write
0.03 0.002723 0 35537 clock_gettime
0.03 0.002645 0 9916 3306 read
0.01 0.001059 0 3379 9 epoll_ctl
0.01 0.000501 0 3327 getsockopt
0.00 0.000033 2 18 sendto
0.00 0.000000 0 9 close
0.00 0.000000 0 2 stat
0.00 0.000000 0 20 mprotect
0.00 0.000000 0 2 rt_sigreturn
0.00 0.000000 0 3 sched_yield
0.00 0.000000 0 9 dup2
0.00 0.000000 0 10 accept
0.00 0.000000 0 26 recvfrom
0.00 0.000000 0 10 getsockname
0.00 0.000000 0 45 setsockopt
0.00 0.000000 0 30 fcntl
------ ----------- ----------- --------- --------- ----------------
100.00 9.864696 69726 3862 total
- vmstat
- mpstat:可以看到每个核的利用率,中断次数
- top:从进程角度查看
- sar:看历史. sar -f /var/log/sa/sa07
内存监控
- free -m
- vmstat
- top
- pmap:查看进程所有的VMA(vm_area_struct)列表
这里解释一下free -m的输出内容。
-bash-3.2$ free -m
total used free shared buffers cached
Mem: 24098 23135 963 0 556 18022
-/+ buffers/cache: 4556 19542
Swap: 2047 0 2047
total = used + free
used = AppUsed + buffers + cachedbuffers 表示块设备读写缓冲区大小。
cached 表示文件系统缓存大小。
第三行第一个字段,表示 used-buffer-cache,也就是被应用使用掉的物理内存大小。第二个字段,表示free+cache+buffer,也就是还可以被应用程序挪用的物理内存大小。
IO监控
- iostat -x 1:分辨顺序IO还是随机IO
- sar -B 1
- top
这里再说明一下iostat的输出。svctm是service time的缩写,表示块设备处理请求耗时。await字段是请求被处理前的等待时间。
avg-cpu: %user %nice %system %iowait %steal %idle
9.43 0.00 0.56 0.00 0.00 90.01
Device: rrqm/s wrqm/s r/s w/s rsec/s wsec/s avgrq-sz avgqu-sz await svctm %util
sda 0.00 0.00 0.00 0.00 0.00 0.00 0.00 0.00 0.00 0.00 0.00
sda1 0.00 0.00 0.00 0.00 0.00 0.00 0.00 0.00 0.00 0.00 0.00
sda2 0.00 0.00 0.00 0.00 0.00 0.00 0.00 0.00 0.00 0.00 0.00
sda3 0.00 0.00 0.00 0.00 0.00 0.00 0.00 0.00 0.00 0.00 0.00
sda4 0.00 0.00 0.00 0.00 0.00 0.00 0.00 0.00 0.00 0.00 0.00
sda5 0.00 0.00 0.00 0.00 0.00 0.00 0.00 0.00 0.00 0.00 0.00
sda6 0.00 0.00 0.00 0.00 0.00 0.00 0.00 0.00 0.00 0.00 0.00
sda7 0.00 0.00 0.00 0.00 0.00 0.00 0.00 0.00 0.00 0.00 0.00
sda8 0.00 0.00 0.00 0.00 0.00 0.00 0.00 0.00 0.00 0.00 0.00
sda9 0.00 0.00 0.00 0.00 0.00 0.00 0.00 0.00 0.00 0.00 0.00
监控java这样一般启动多线程的进程,简单的strace -p pid什么也看不到。需要增加 -f 这个参数,man上说这个参数的意思是监控该进程及其子进程。
strace -f -p pid
统计syscall的调用次数和耗时
strace -f -p 27847 -c
% time seconds usecs/call calls errors syscall
------ ----------- ----------- --------- --------- ----------------
66.10 6.520408 2443 2669 547 futex
33.35 3.289478 534 6162 epoll_wait
0.46 0.044990 1730 26 poll
0.03 0.002859 0 8526 write
0.03 0.002723 0 35537 clock_gettime
0.03 0.002645 0 9916 3306 read
0.01 0.001059 0 3379 9 epoll_ctl
0.01 0.000501 0 3327 getsockopt
0.00 0.000033 2 18 sendto
0.00 0.000000 0 9 close
0.00 0.000000 0 2 stat
0.00 0.000000 0 20 mprotect
0.00 0.000000 0 2 rt_sigreturn
0.00 0.000000 0 3 sched_yield
0.00 0.000000 0 9 dup2
0.00 0.000000 0 10 accept
0.00 0.000000 0 26 recvfrom
0.00 0.000000 0 10 getsockname
0.00 0.000000 0 45 setsockopt
0.00 0.000000 0 30 fcntl
------ ----------- ----------- --------- --------- ----------------
100.00 9.864696 69726 3862 total
订阅:
博文 (Atom)